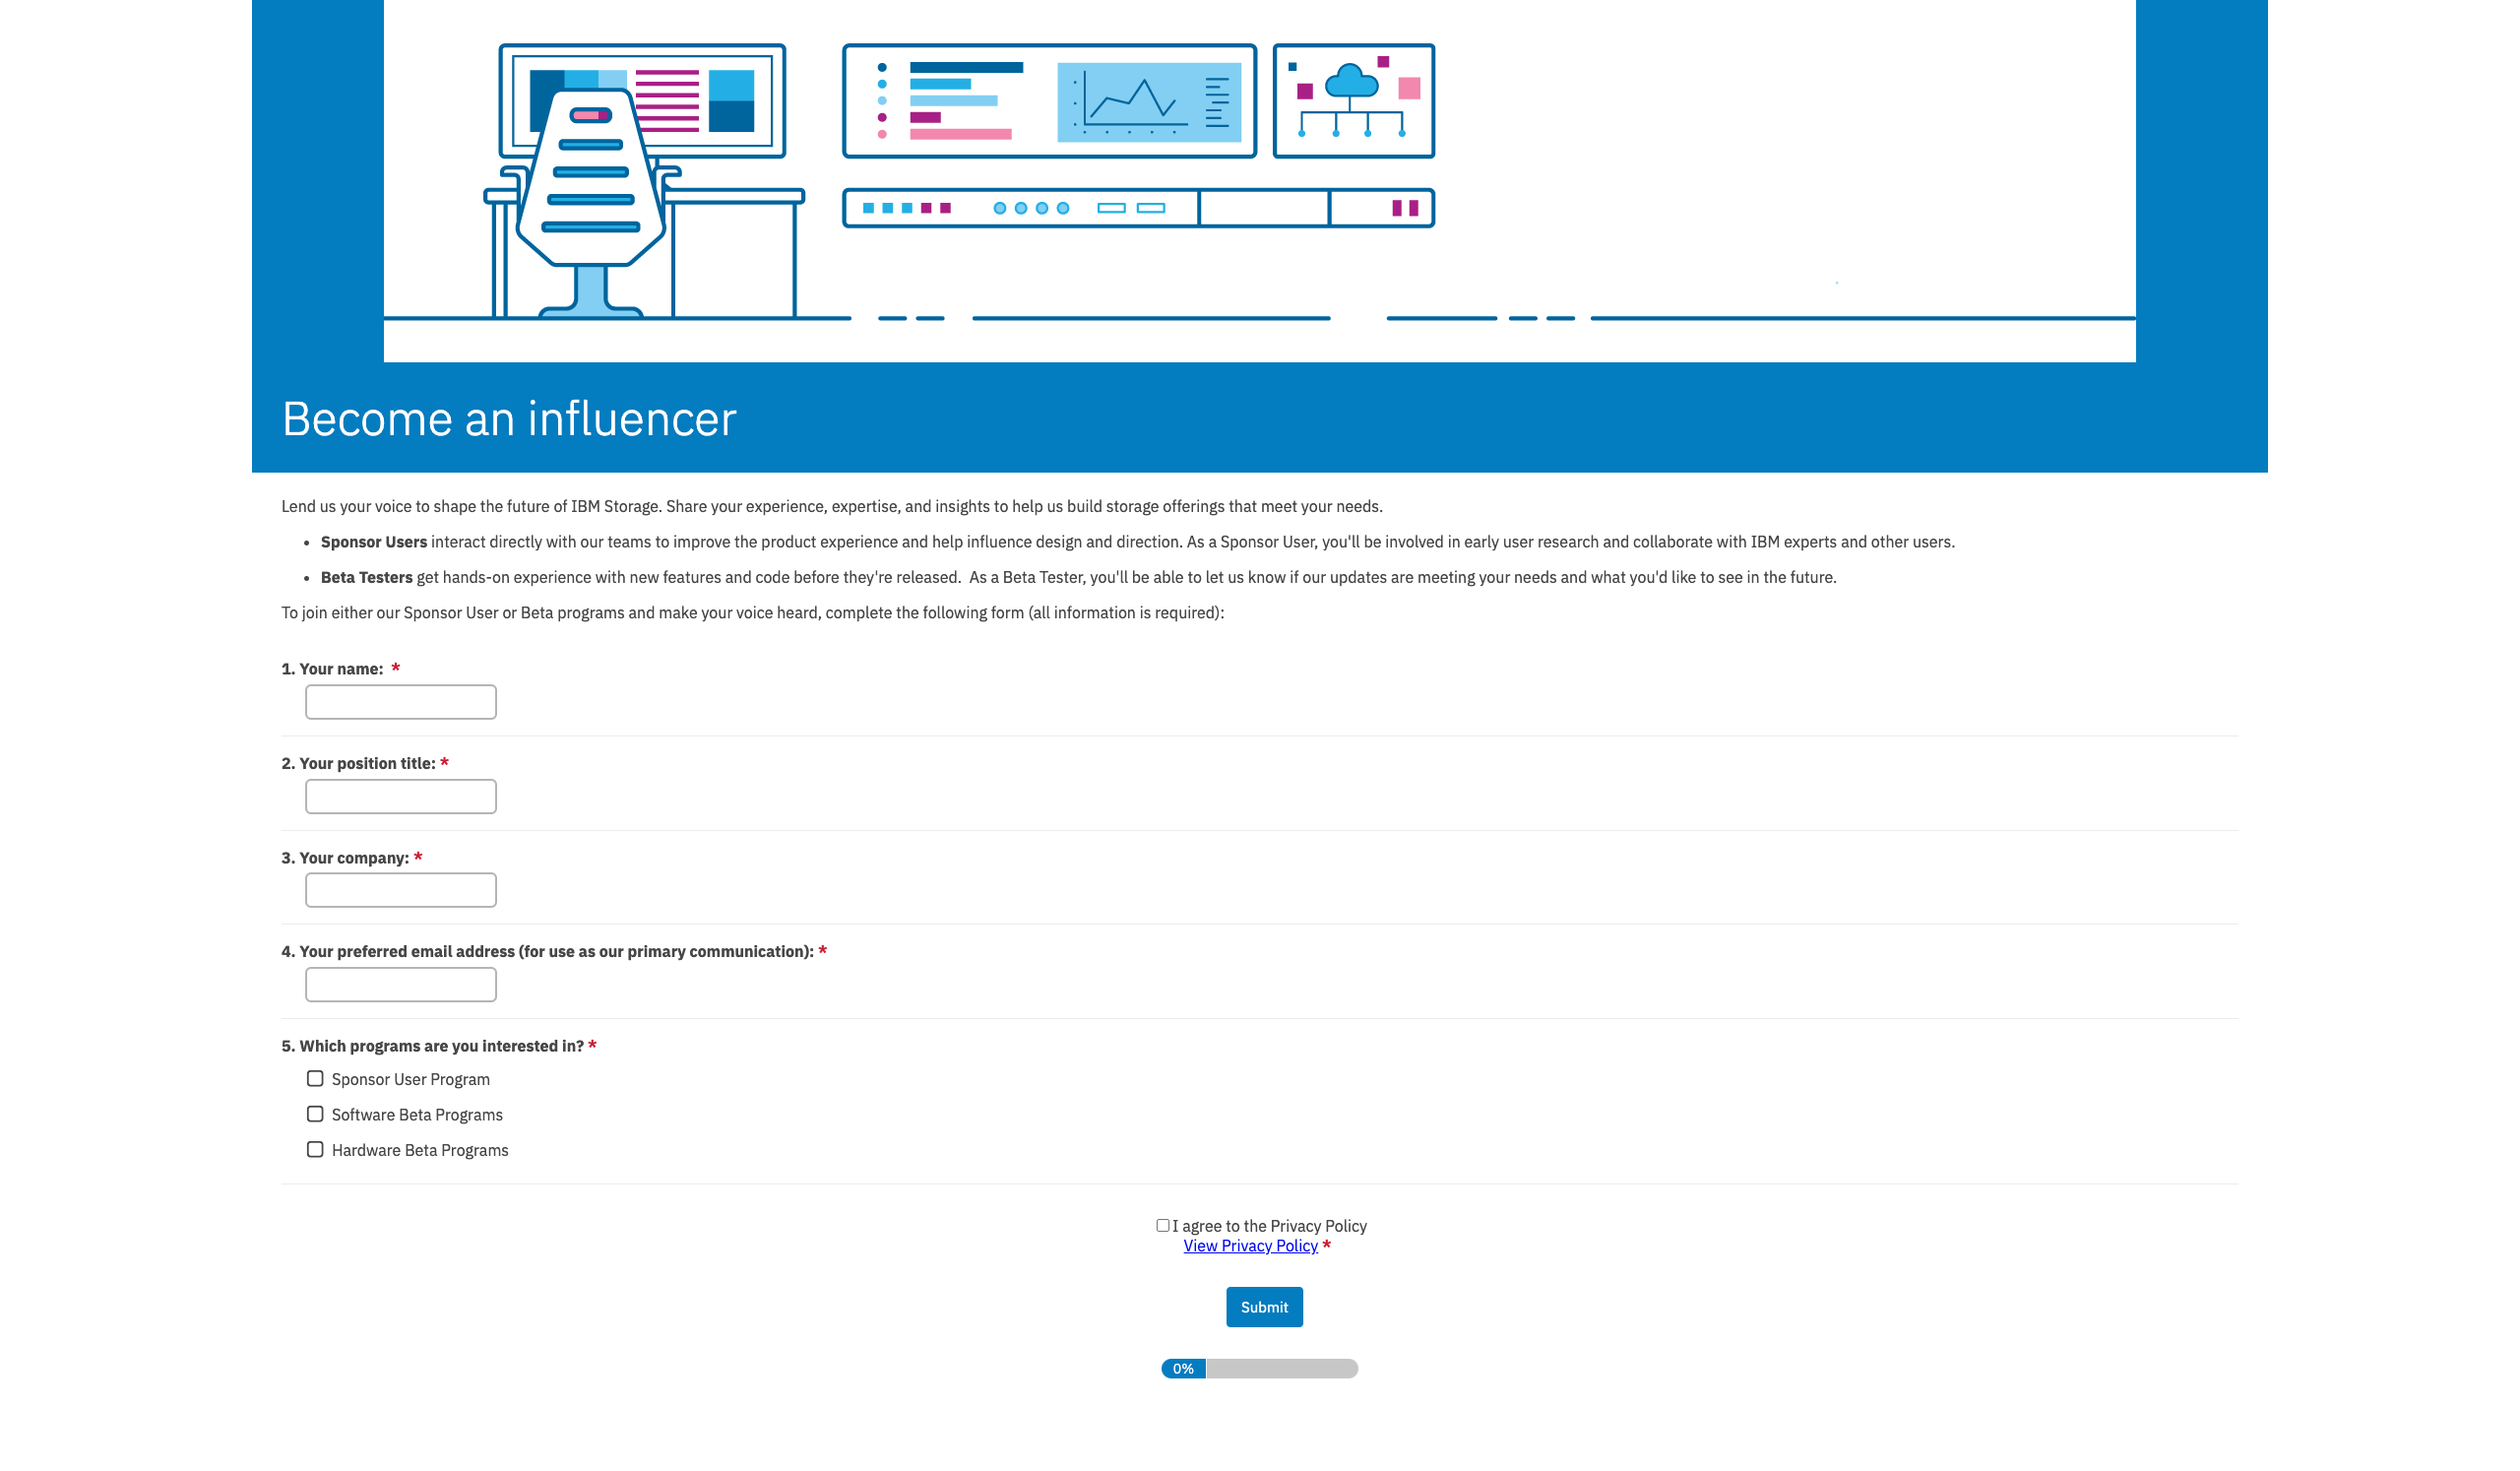
The Tanzu Developer Tools shown in the 3 supported coding environments
My Role: Lead Product Designer for Tanzu Developer Tools.
Technologies Used: Figma, Dovetail, Miro, UserZoom, VS Code, IntelliJ, Visual Studio, K9s, Tanzu CLI, kubectl, GCP, Azure.
Methodologies: Usability studies, research synthesis, ideal experience exercise, rapid prototyping, iterative design, and a lot of collaboration with cross-functional partners (PM, Eng, Tech leads).
When I joined VMware I started working on a product called Tanzu Application Platform, also known as TAP. TAP is an abstraction layer which makes it possible for you to use any Kubernetes provider without needing to tailor your setup for each specific environment. I joined before TAP had released to the public, and as an organization we were still working on very early pre-alpha proof of concept pieces of the overall platform.
I joined the team working on Developer Tools. Our goal was to create something an application developer could use directly within their coding software to manage their application running on TAP. We called this the Tanzu Developer Tools.
I became the lead designer of the Tanzu Developer Tools portion of the overall TAP project with that as my goal: how might we enable application developers to interact with and understand their applications on TAP from directly within their coding software? Initially I was tasked with answering this question for 2 different pieces of coding software, and then later upon the release of TAP I was responsible for the design direction of the Tanzu Developer Tools in a third piece of coding software.
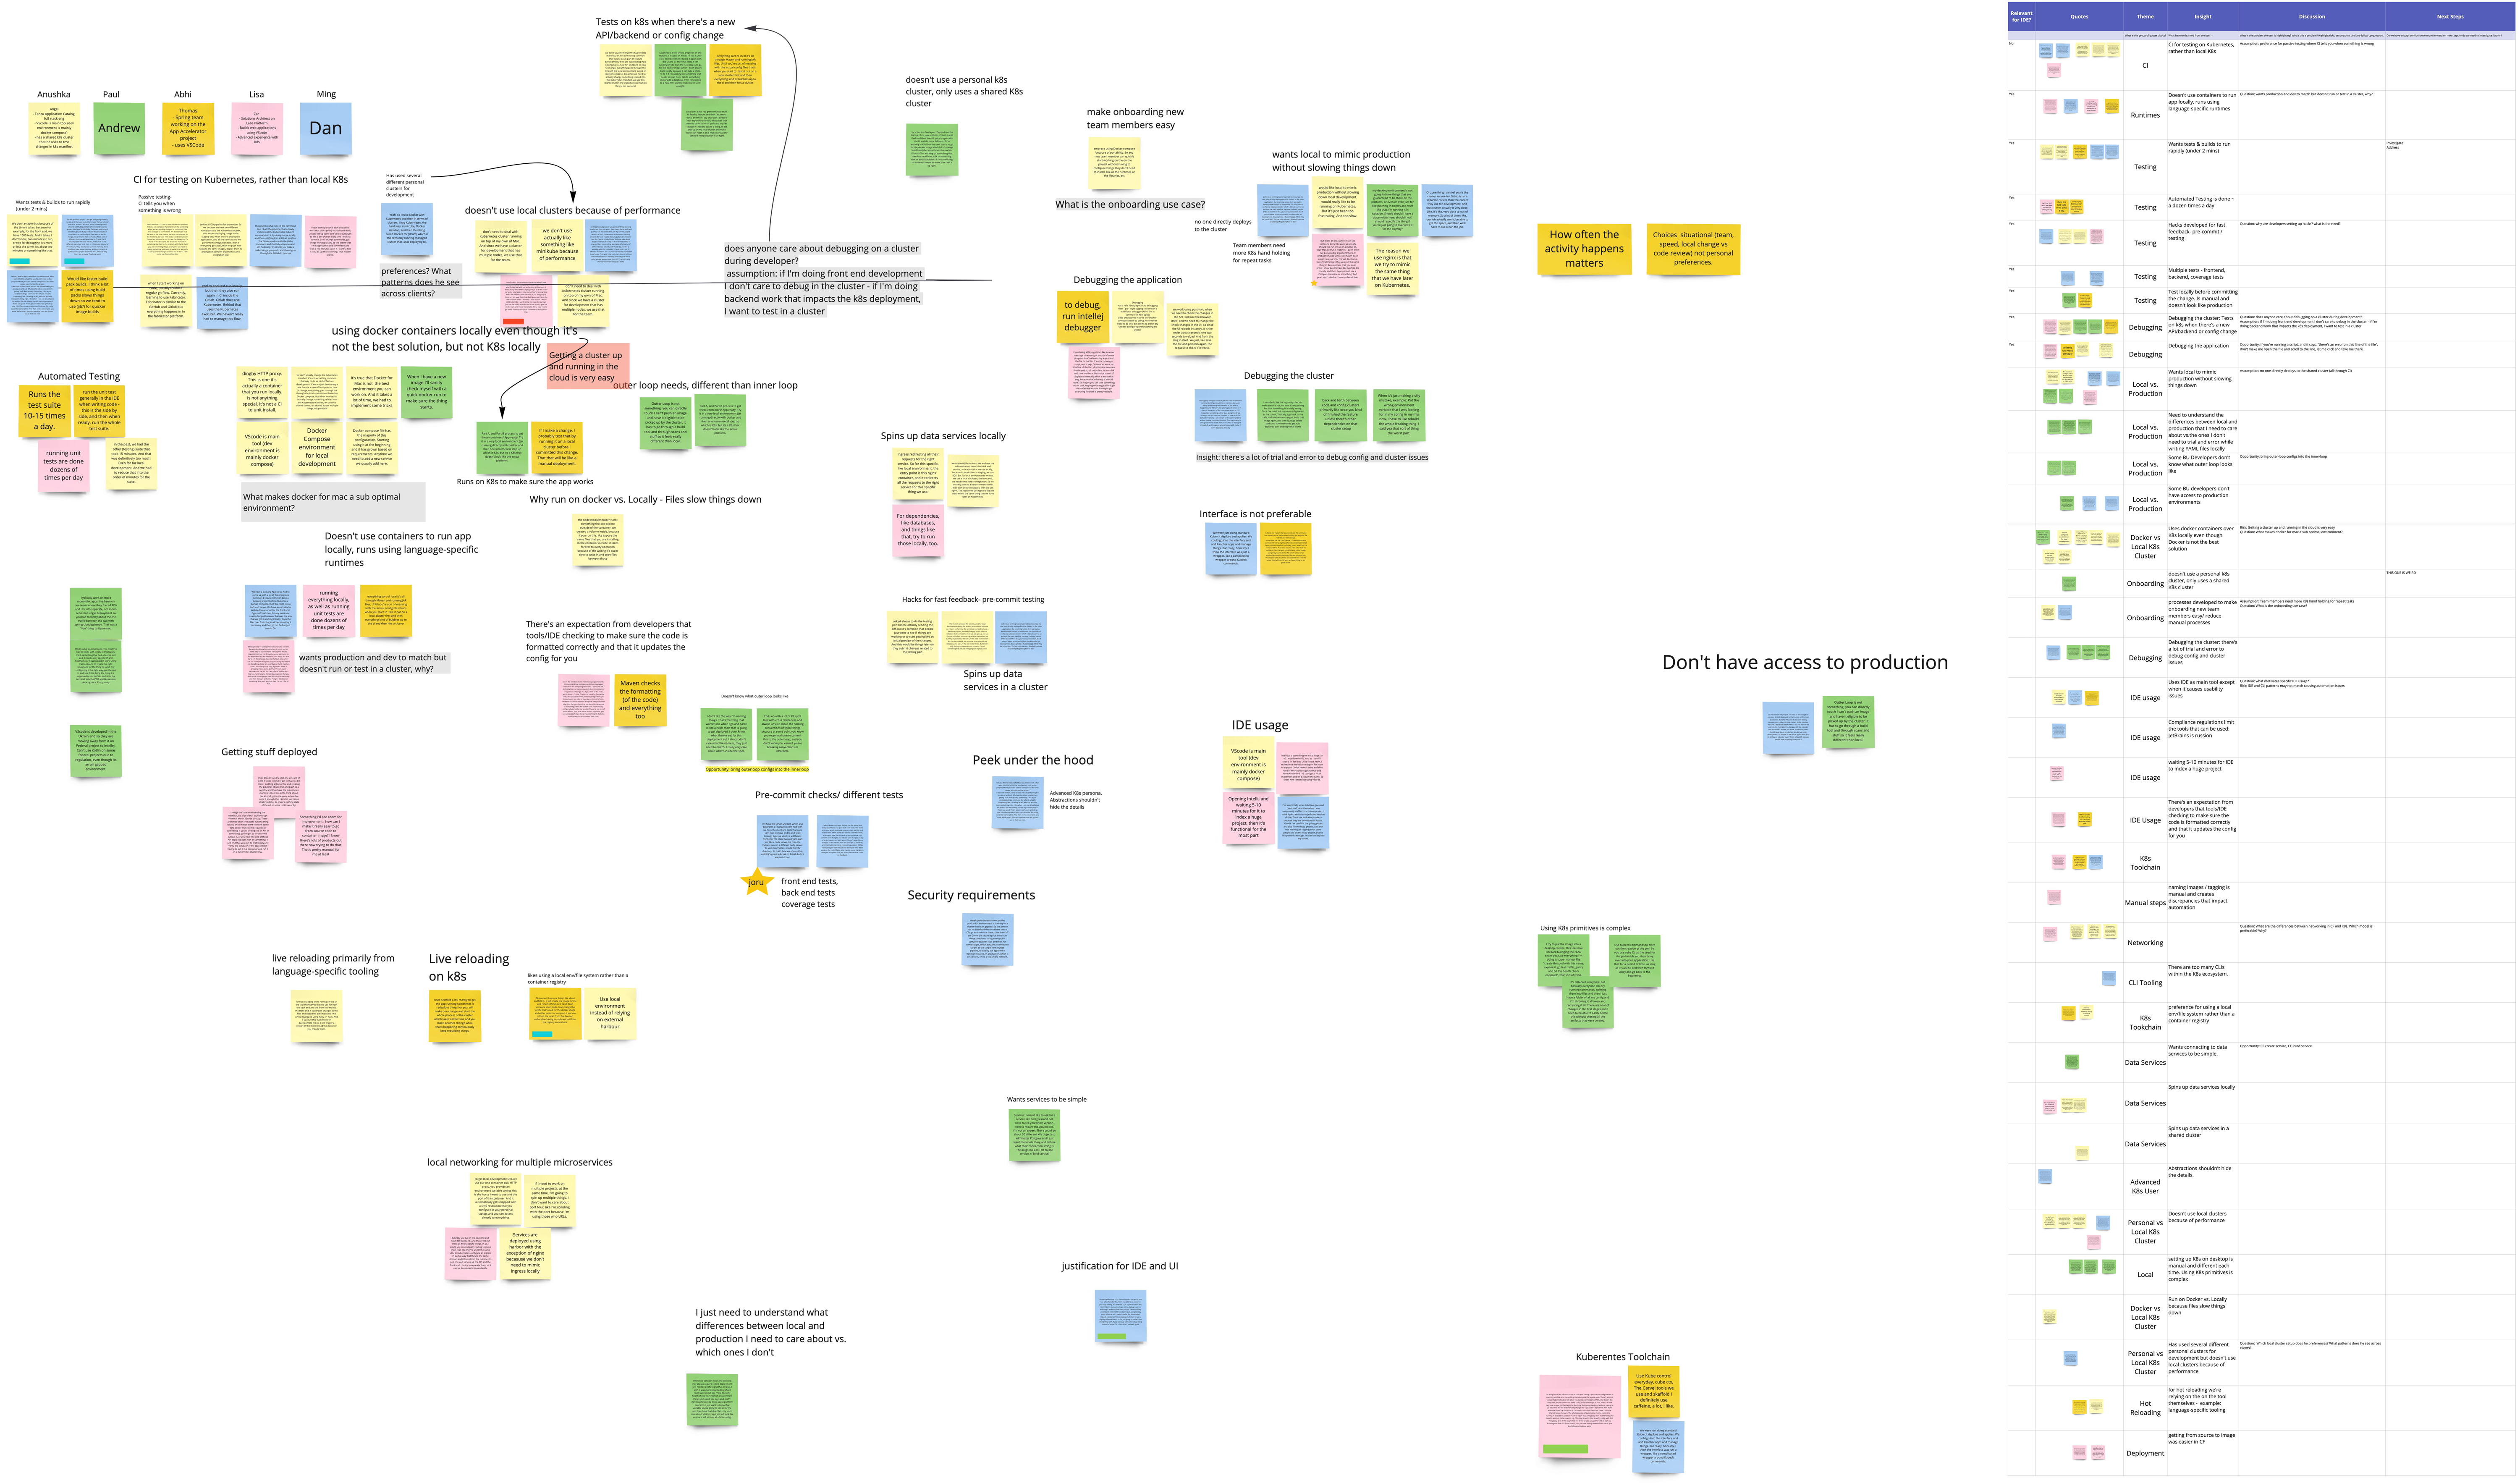
I joined the team after they had completed a Proof of Concept and had just finished testing it with 5 users.
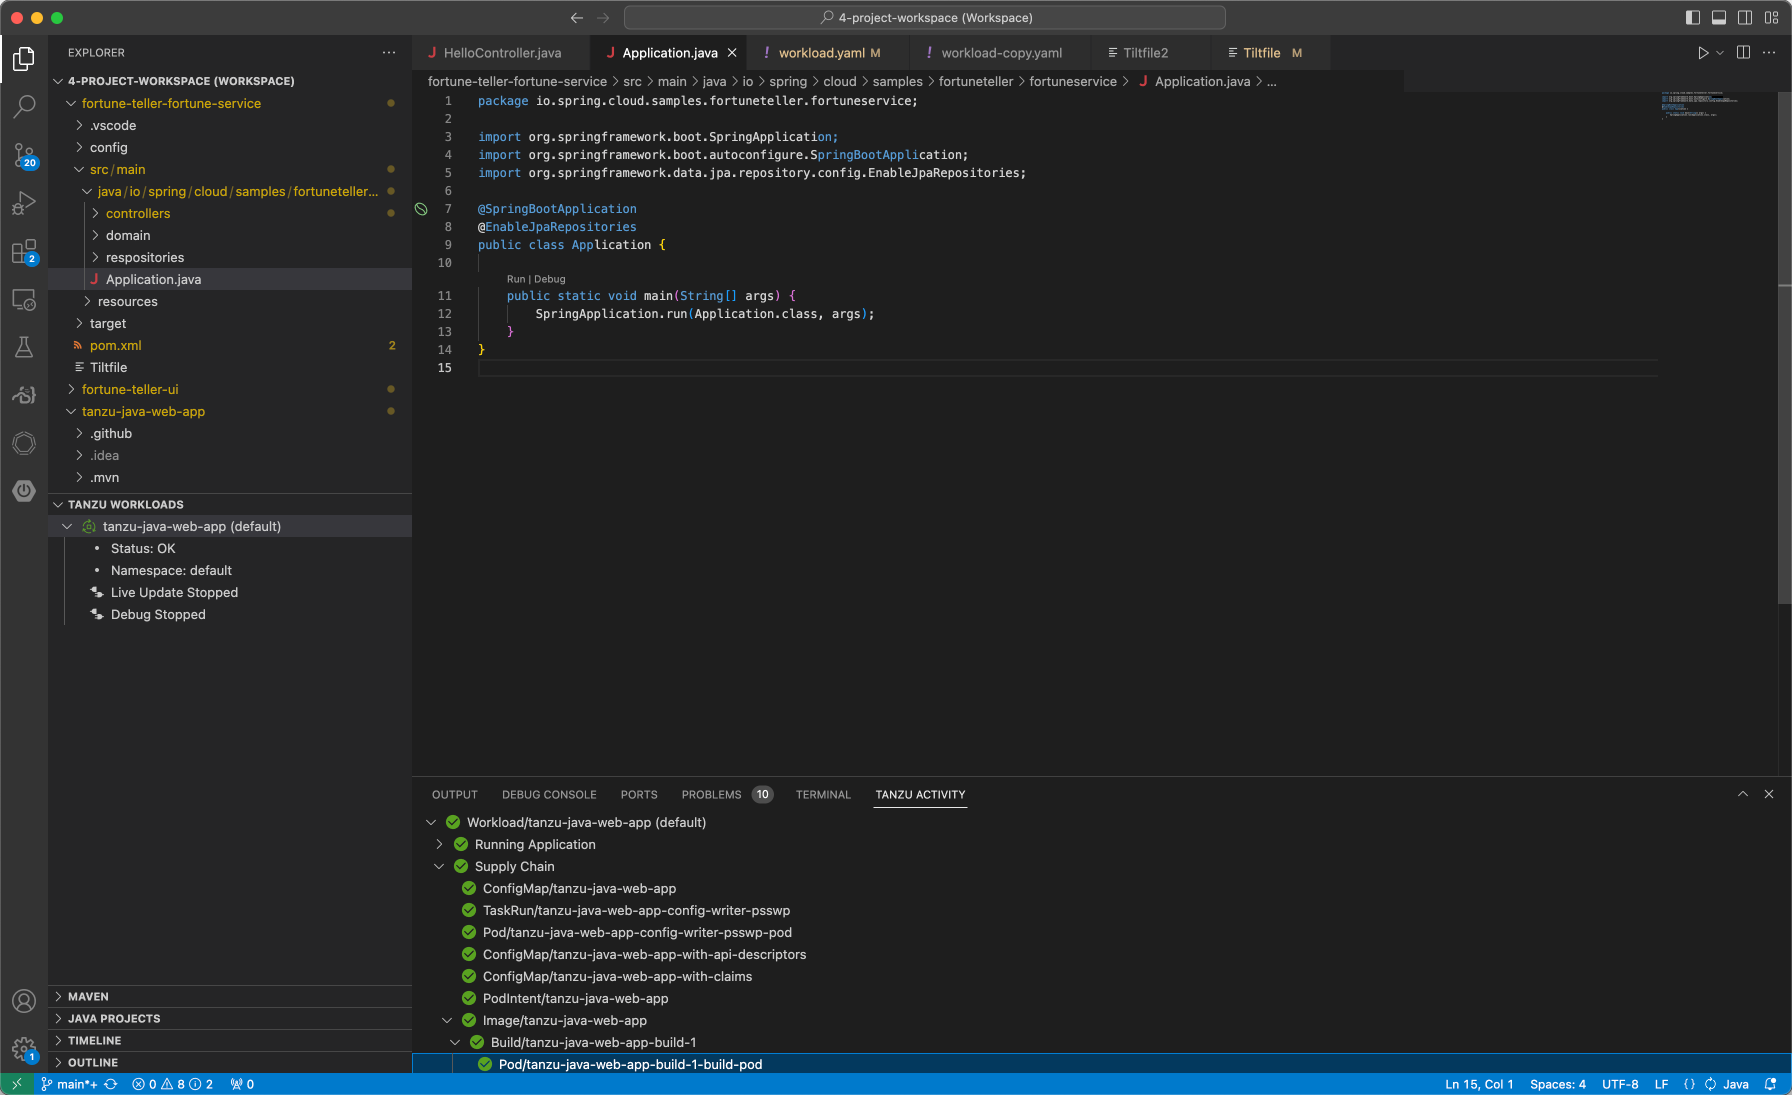
The Tanzu Developer Tools Proof of Concept
When the team’s Proof of Concept was released this was the only functionality it had. It could Live Update, meaning update code changes to your running application without necessitating a full rebuild and redeploy. This Live Update feature was only accessible via the Command Prompt.
Research Insights Grouped, Follow-up Tasks Categorized
Though the team had completed testing, they hadn’t synthesized any of their notes or recordings yet. The first thing I did was work with the team’s Product Manager, and at times other team members, to synthesize the research findings into insights. I then plotted those insights into actionable follow-up tasks.
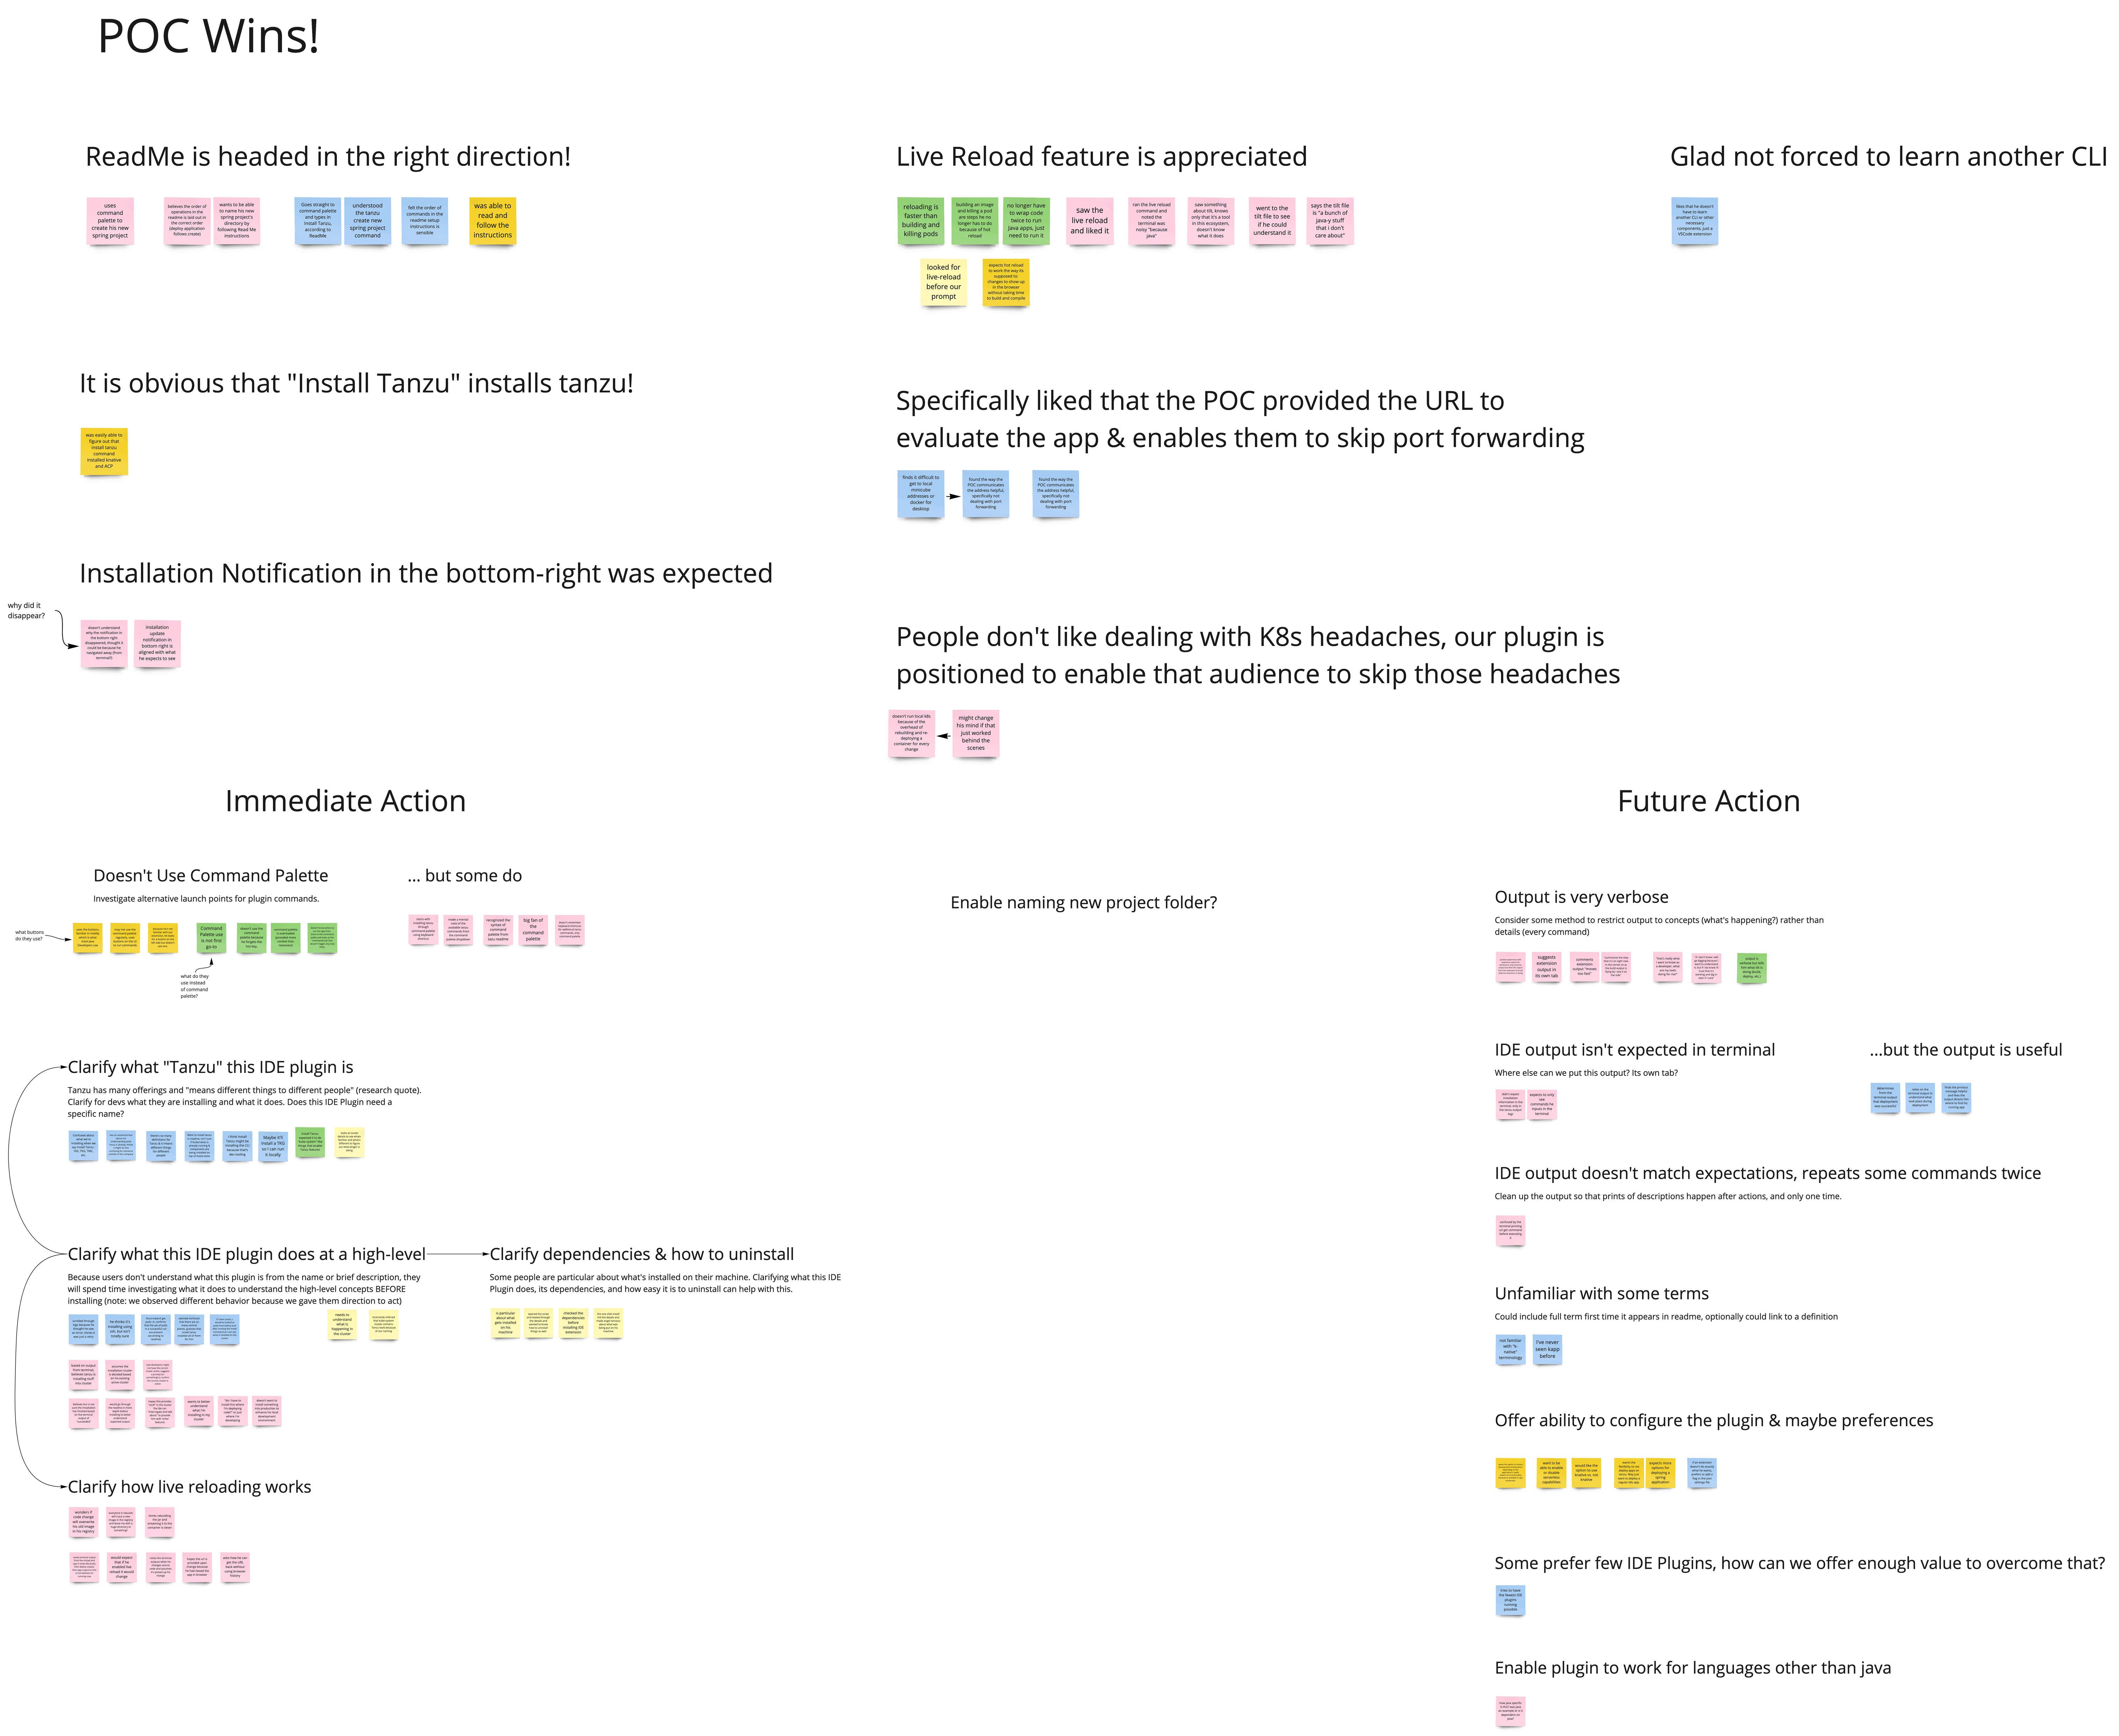
Proof of Concept Wins, Follow-up Action Planning
Next I met with the team to discuss and review the synthesis. We identified and celebrated some of the things we received positive feedback about from the Proof of Concept and called these our wins. We then discussed the prioritized list of follow-up tasks and filed them into one of three categories: Immediate Action which were the things we planned to work on in the Alpha and Beta releases, and Future Action which were things we planned to work on for the MVP GA release or beyond, we didn’t have any tasks that fell into our third category which was no action planned.
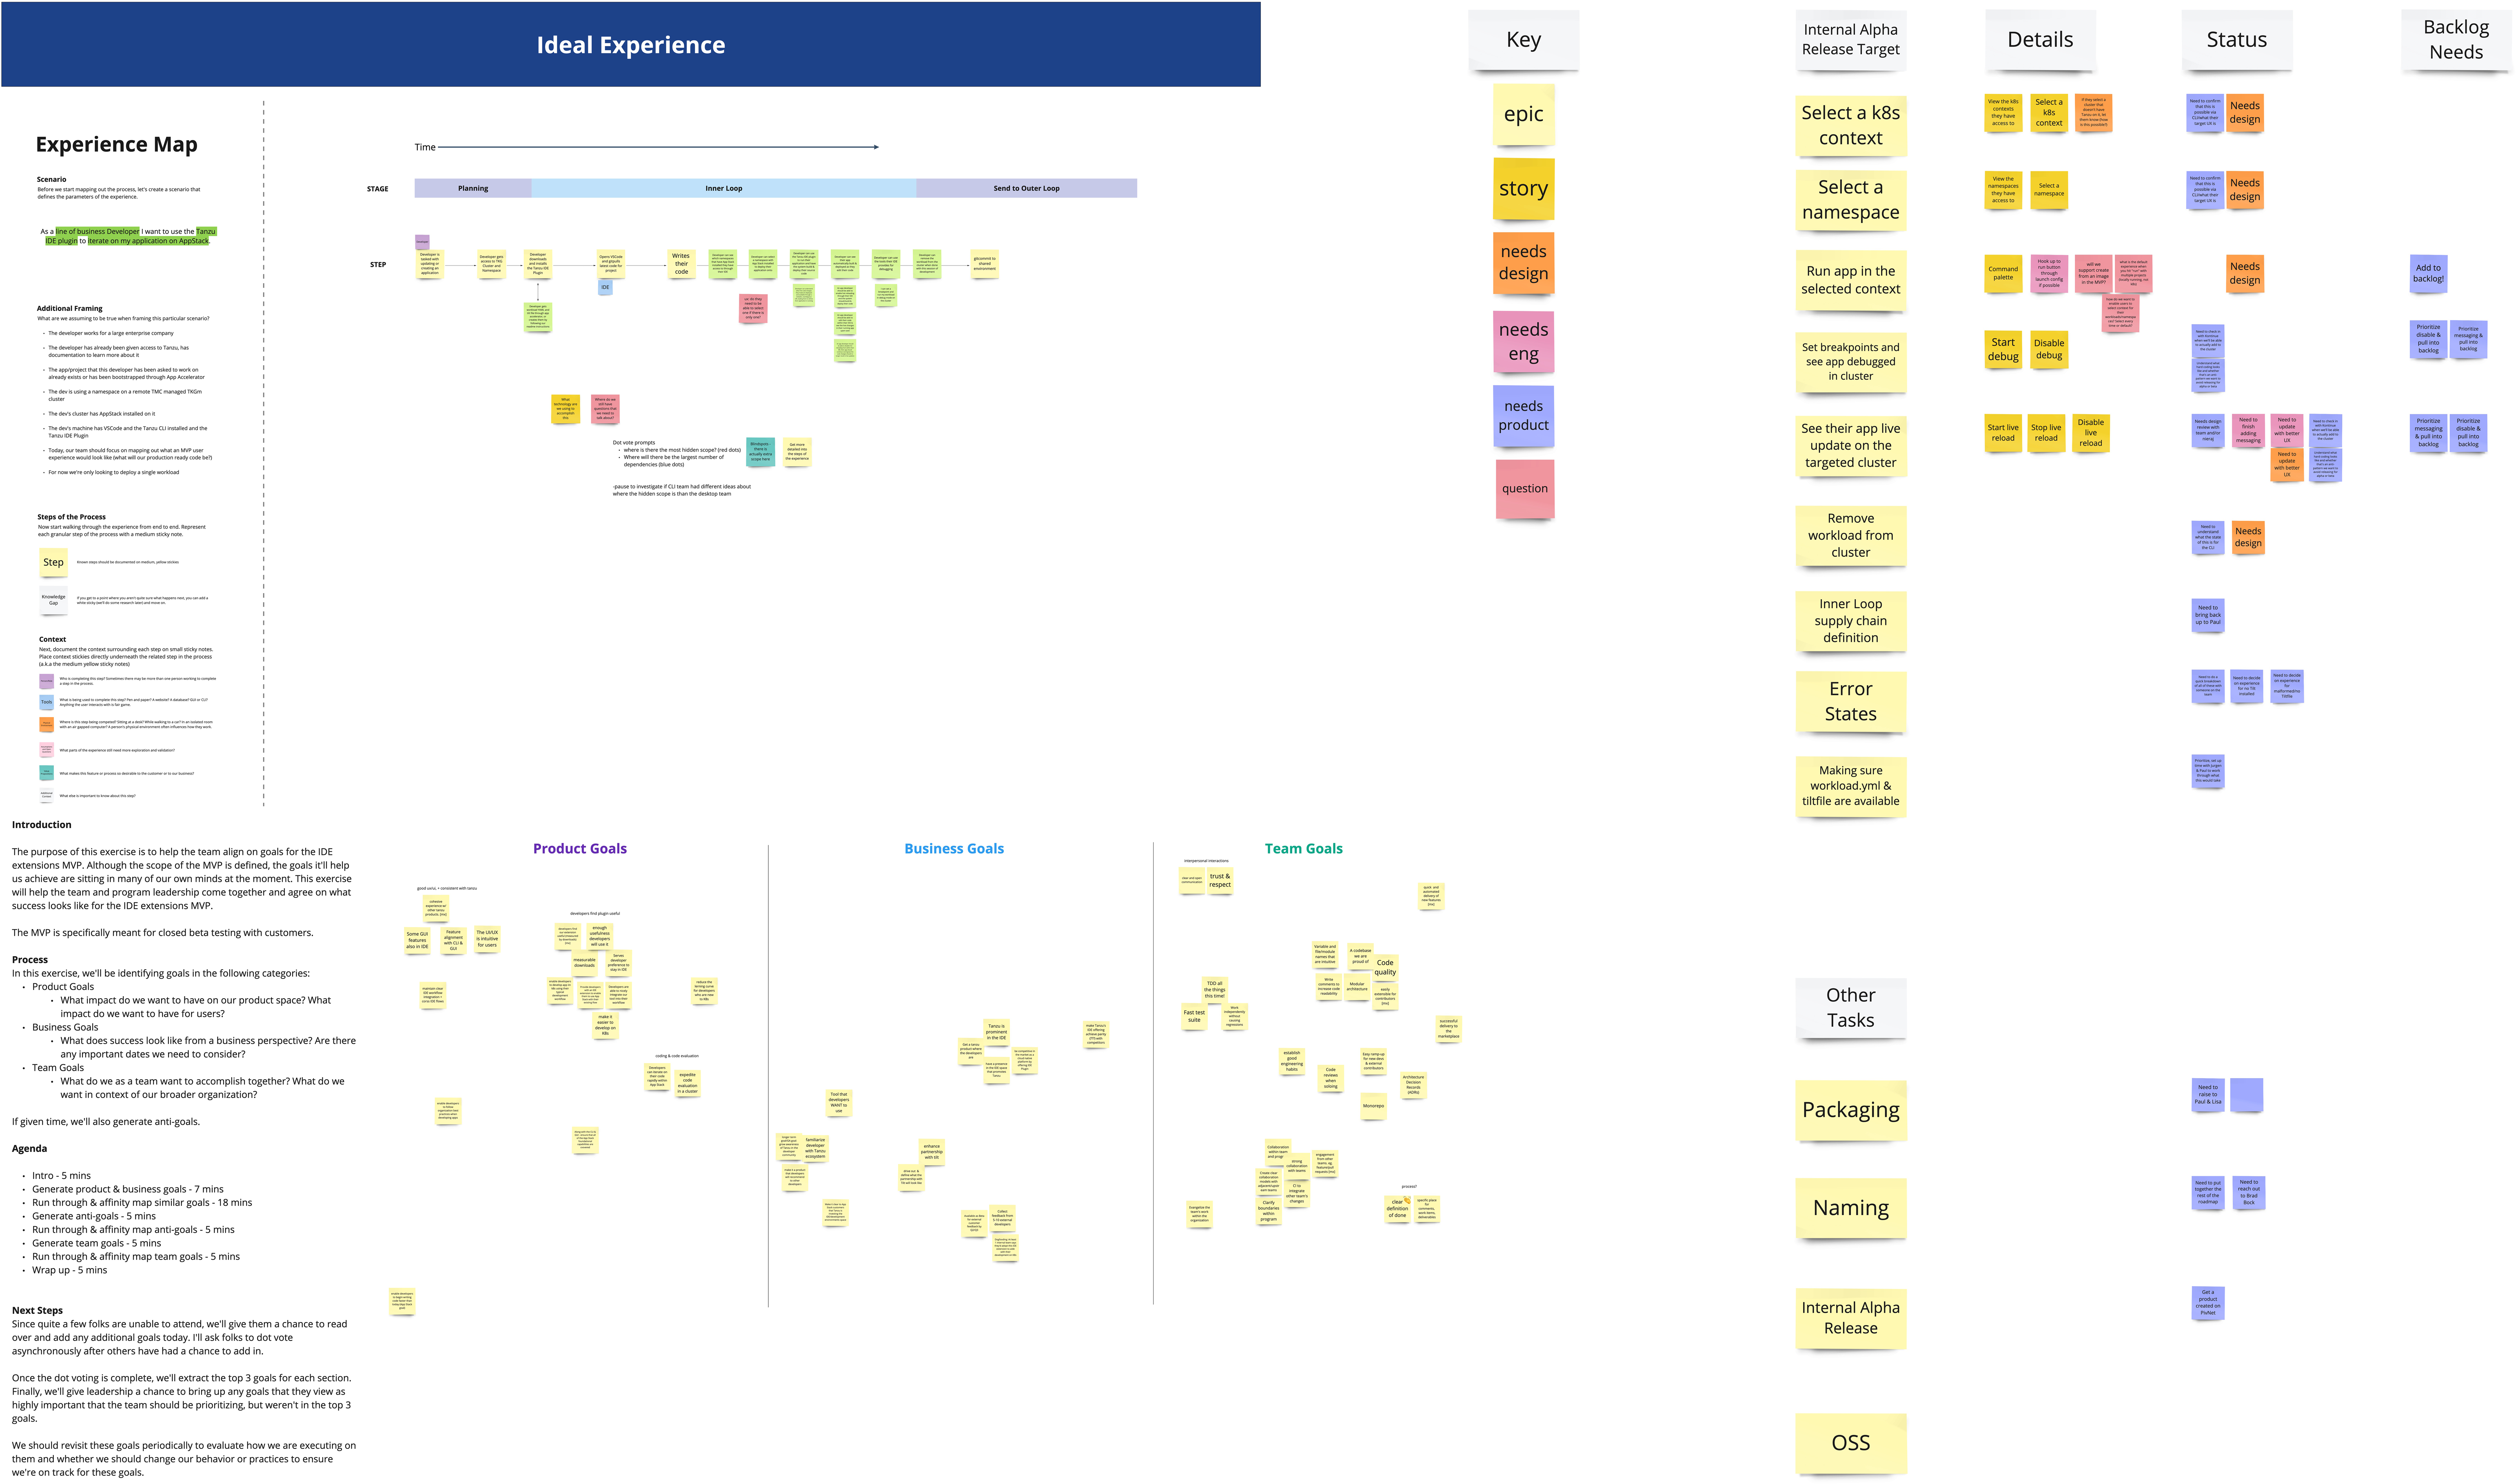
Moving from insight to action, focused on a target experience, grounded in specific goals.
Following our task review I scheduled a few additional team exercises to ensure we were properly aligned on our release plans.
First I brought the team together to map our ideal experience. We reviewed what the team’s initial goal was pre-proof of concept, and what priorities had shifted in our broader program in the interim. Then we collaboratively mapped out the ideal experience we wanted to work toward in our MVP at GA.
Next I led us in using our list of follow-up tasks from the research and our mapped ideal experience to populate three categories, Product Goals, Business Goals, and Team Goals. I wanted to ensure that the tasks we were creating for ourselves mapped to specific goals that all of our team members understood, felt were valid, and we could rally behind and become excited about.
Finally, I led us in an exercise to identify which team group, design, engineering, or product management, had outstanding work for each of our new tasks.
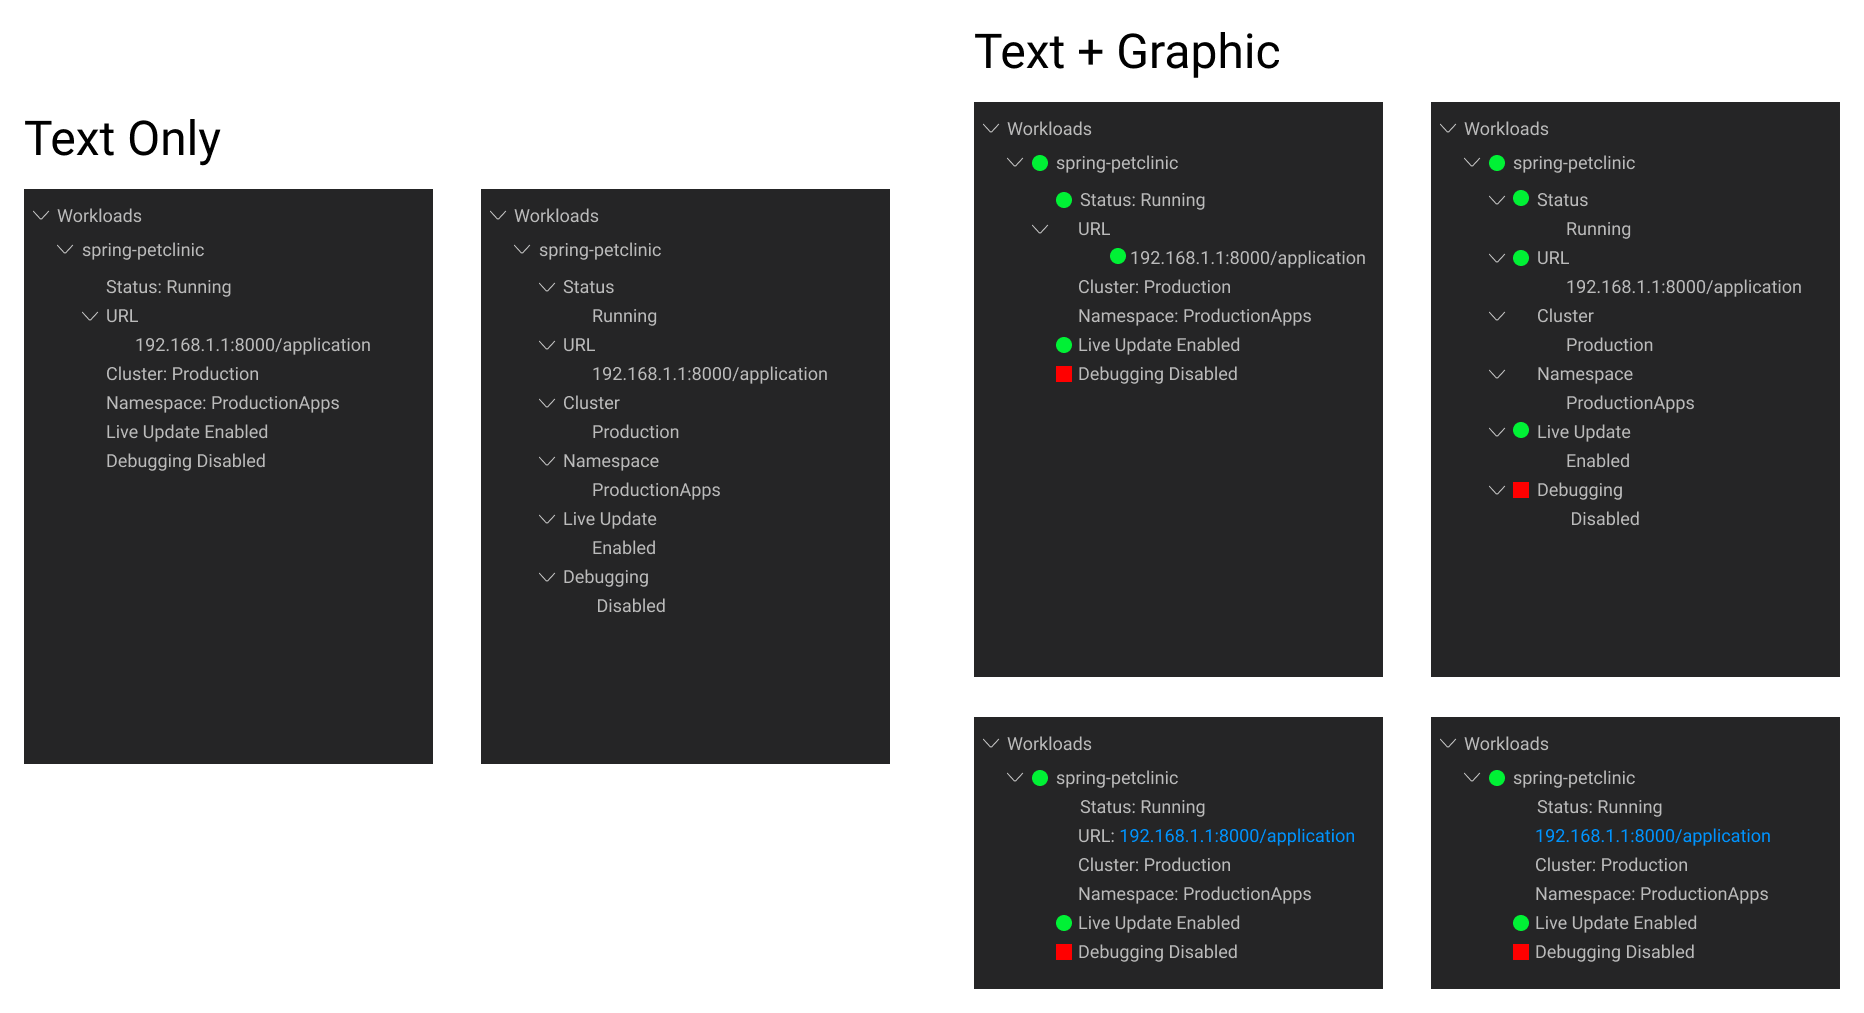
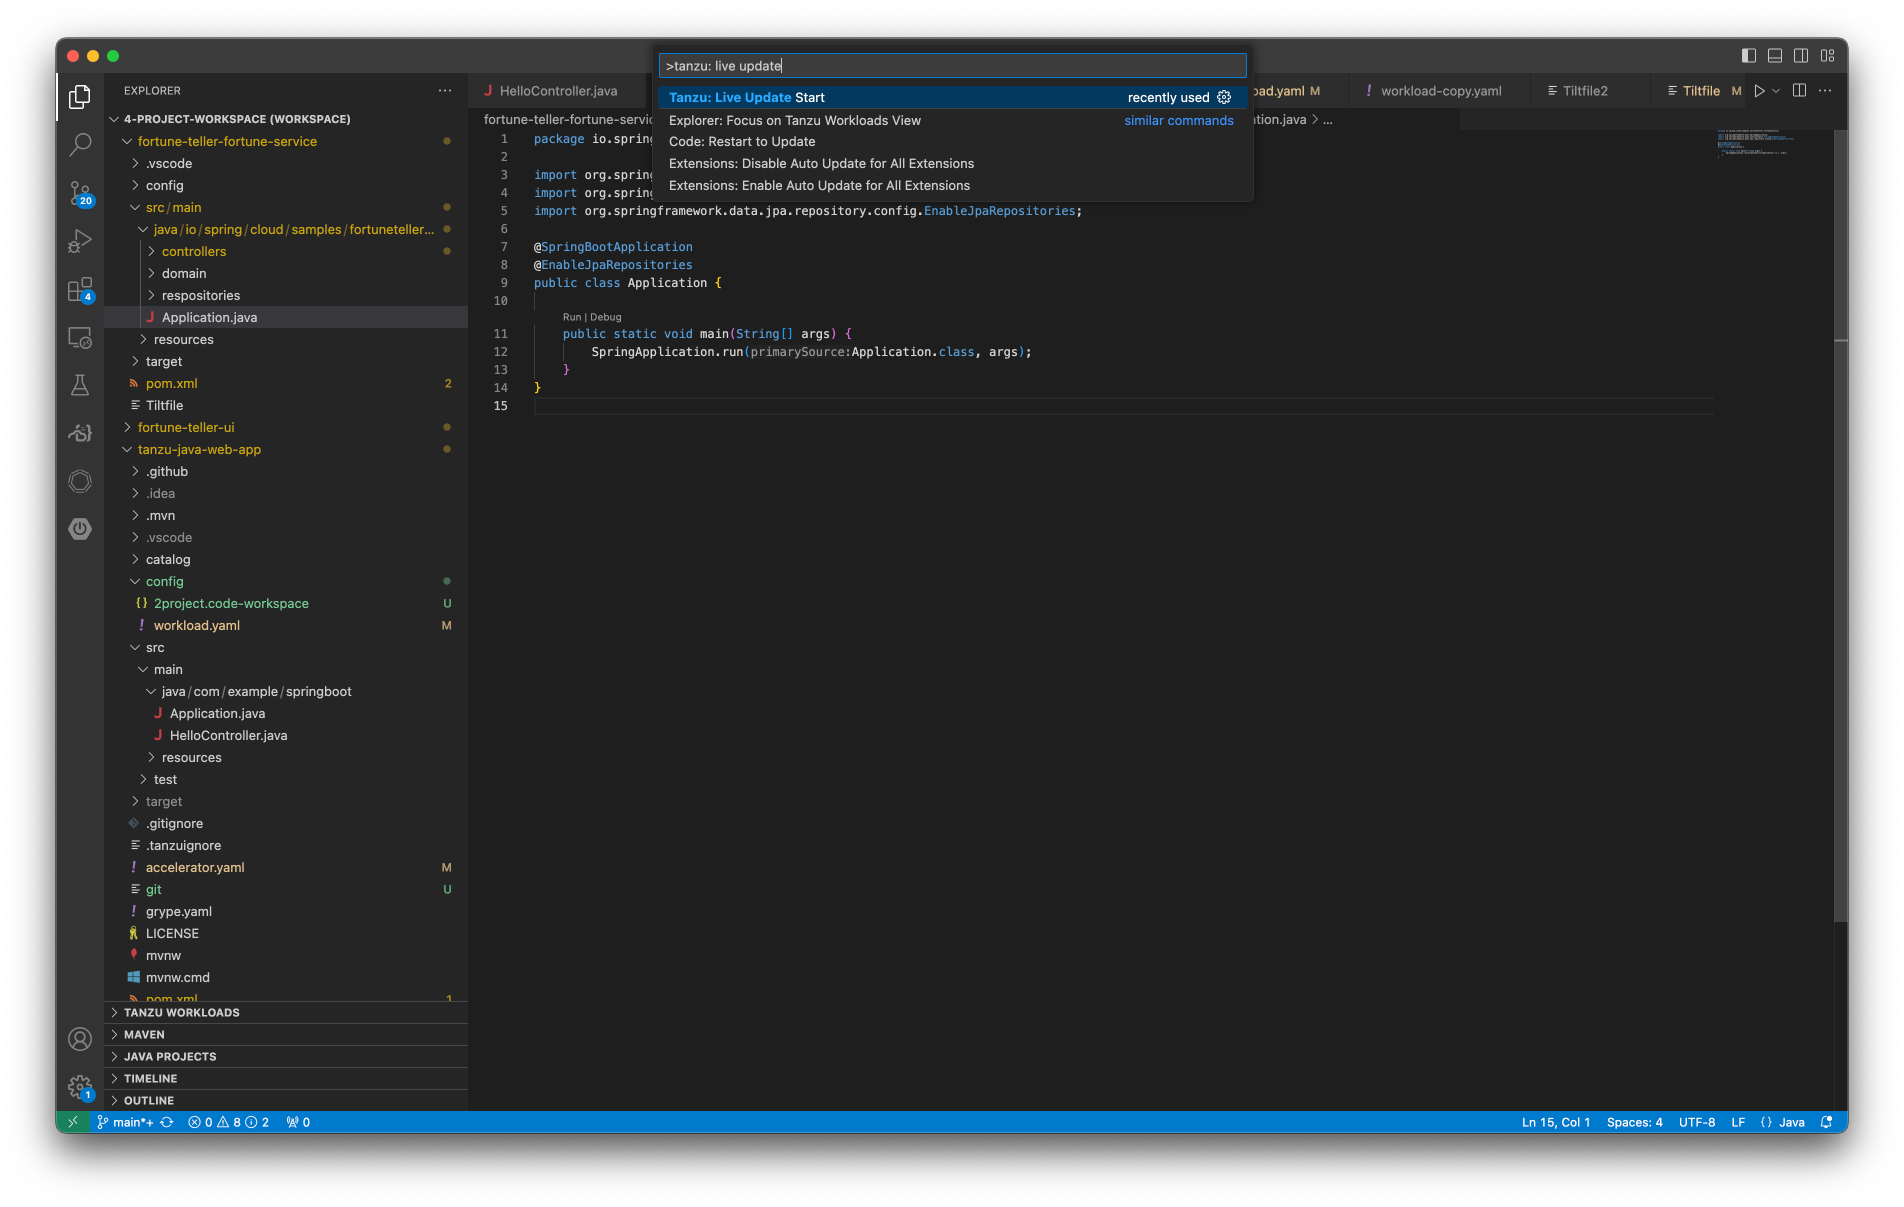
Text-only Exploration, Text & Graphic Exploration
One of the primary requests we heard in the research feedback was developers wanted a way to understand which application, or which application components in the case of a microservice, were currently on the developer’s target cluster. Additionally, developers needed a way to understand essential status and configuration information about those applications.
As I brainstormed solutions to this need I investigated many methods of conveying the necessary information, from an information dense command line interface to an information-lite singular status icon, landing somewhere in the middle with a new panel designed to sit alongside the developer’s code window.
When I settled on exploring the concept of this new panel I began to imagine ways I might show the developer their application information, including using only text, using text accompanied by graphics, and others.
![]()
Clarity Design System Icons, Tanzu Mission Control Icons, Generic Shape Icons
I felt pairing graphics with text struck a useful balance between the at-a-glance comprehension of an icon, with the description of text. I worked with the central VMware design organization Clarity, with designers from other products in my design group, with the individual IDE design style guides, and used my own creativity to mock up a multitude of different icon and text combinations. These are just some of the icon and text combinations I explored and solicited feedback and input from my team and my design group on.
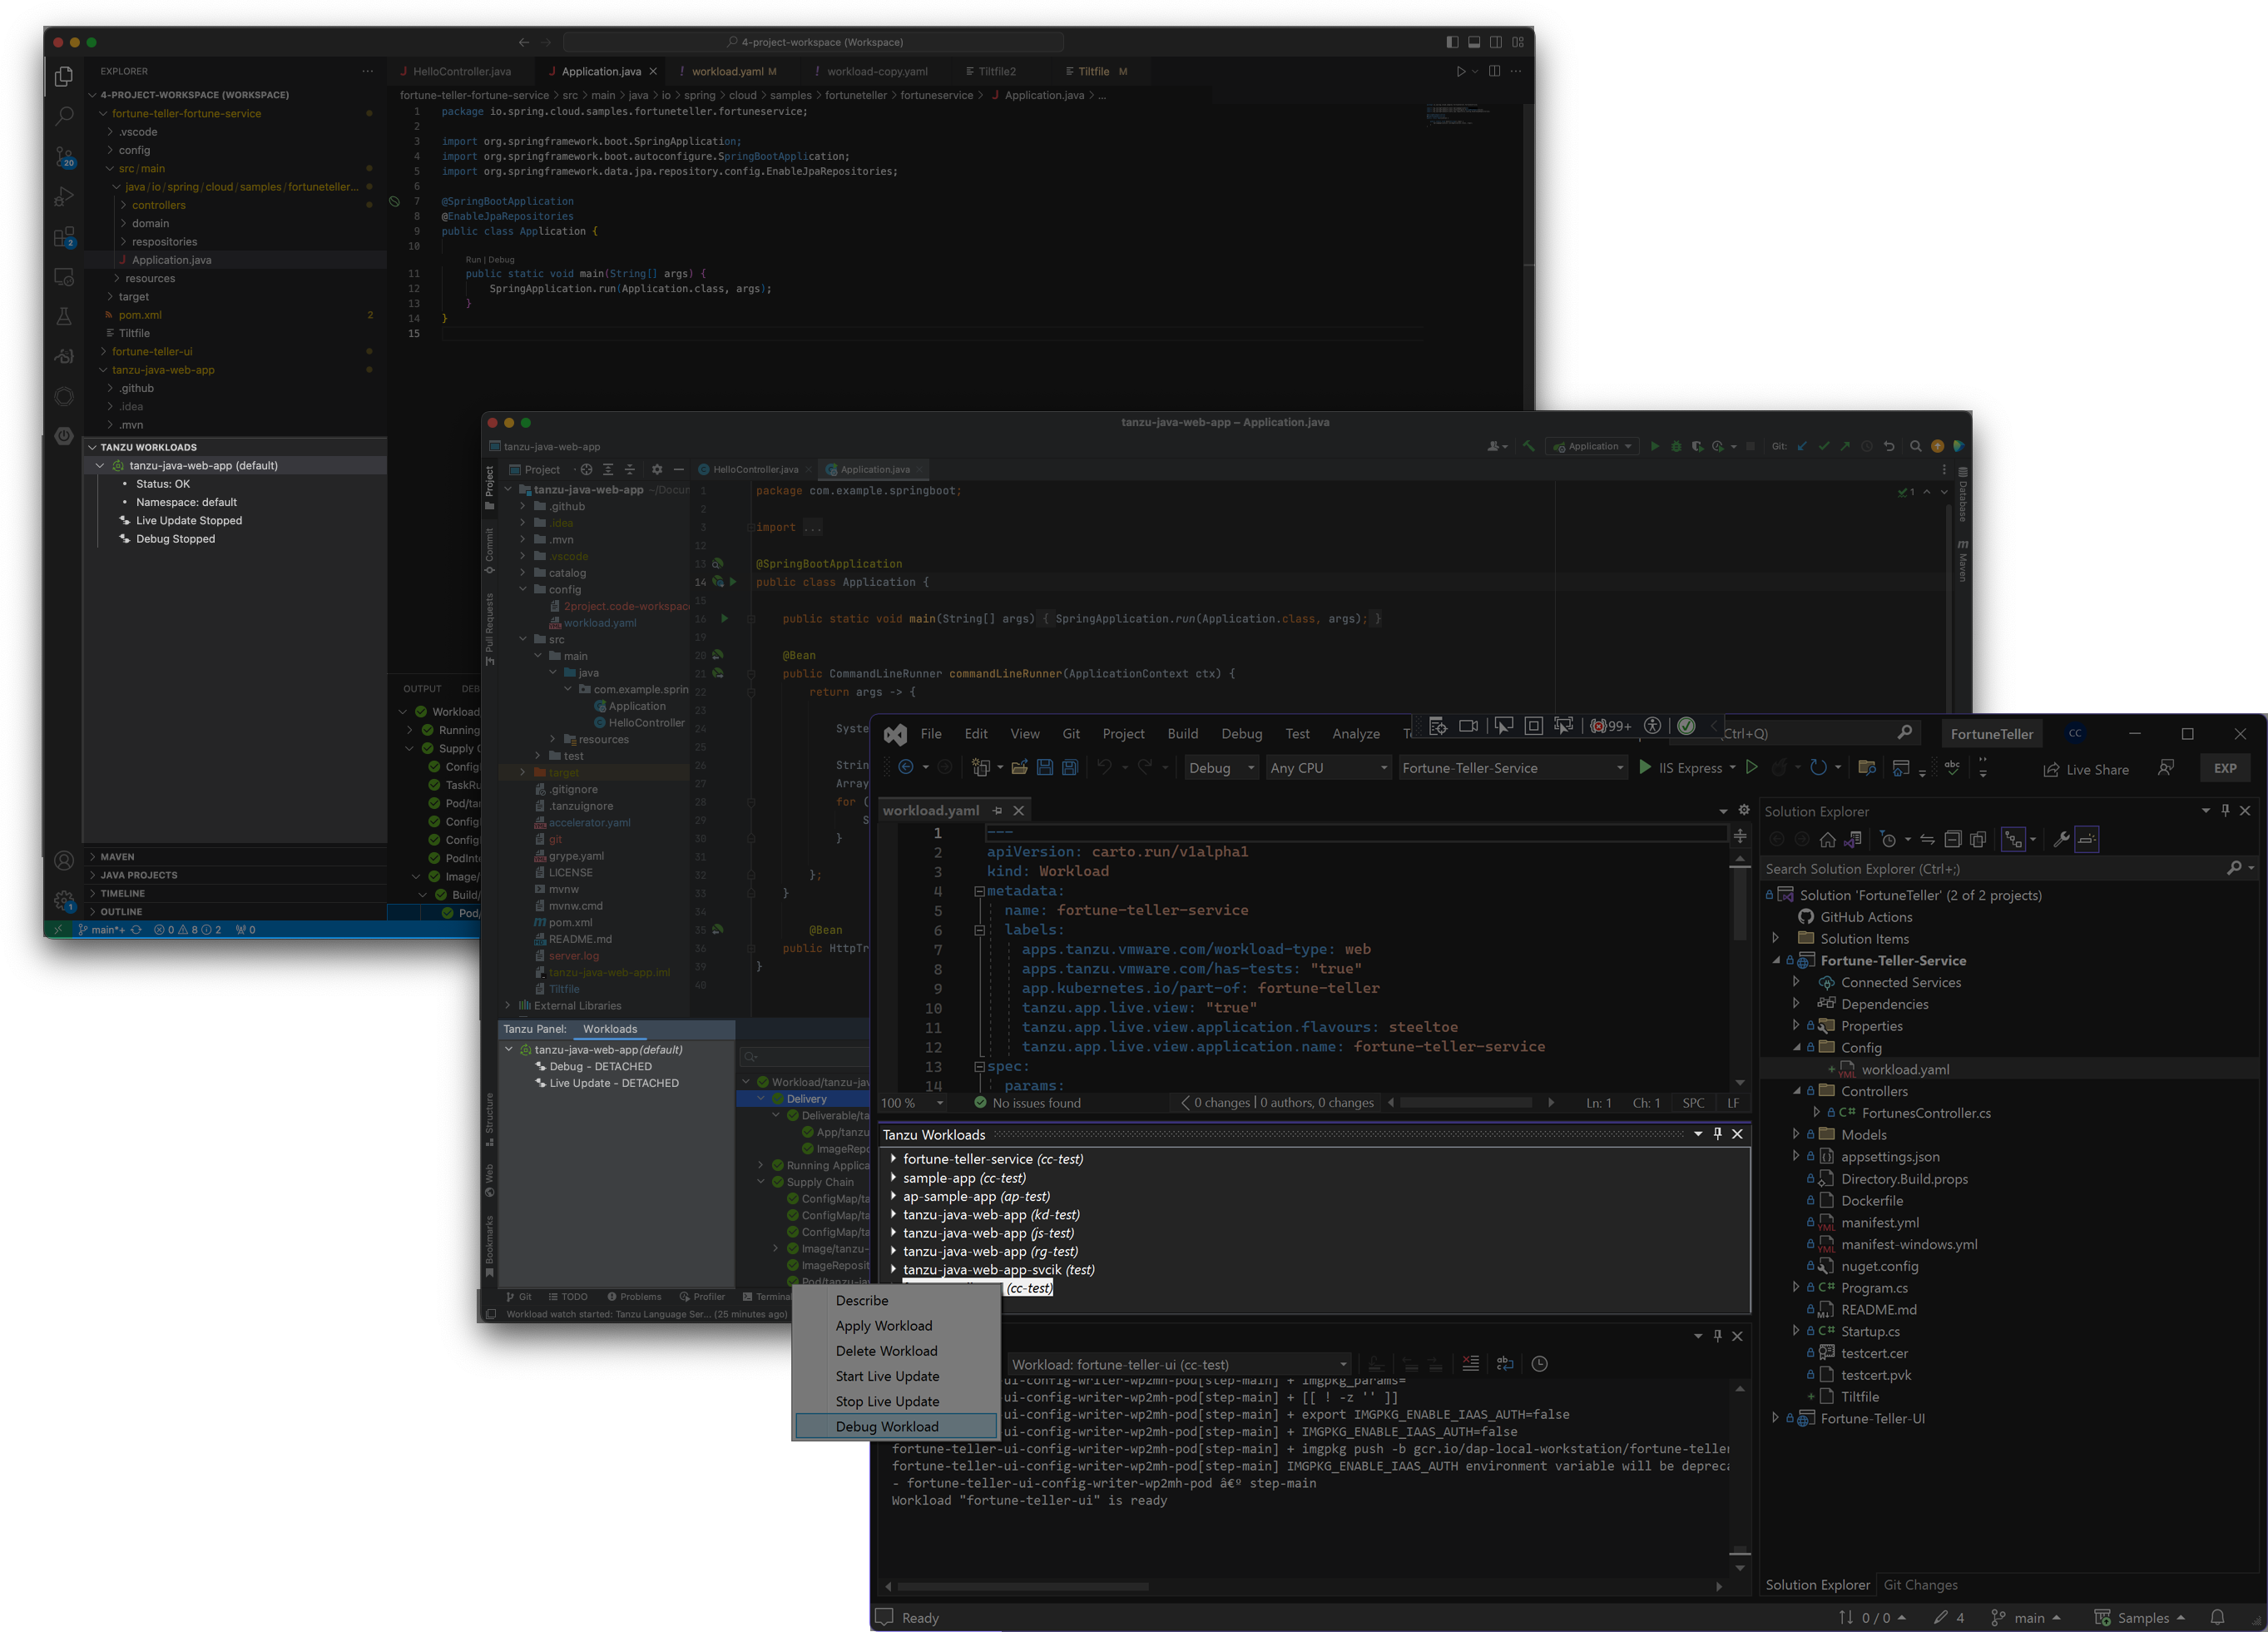
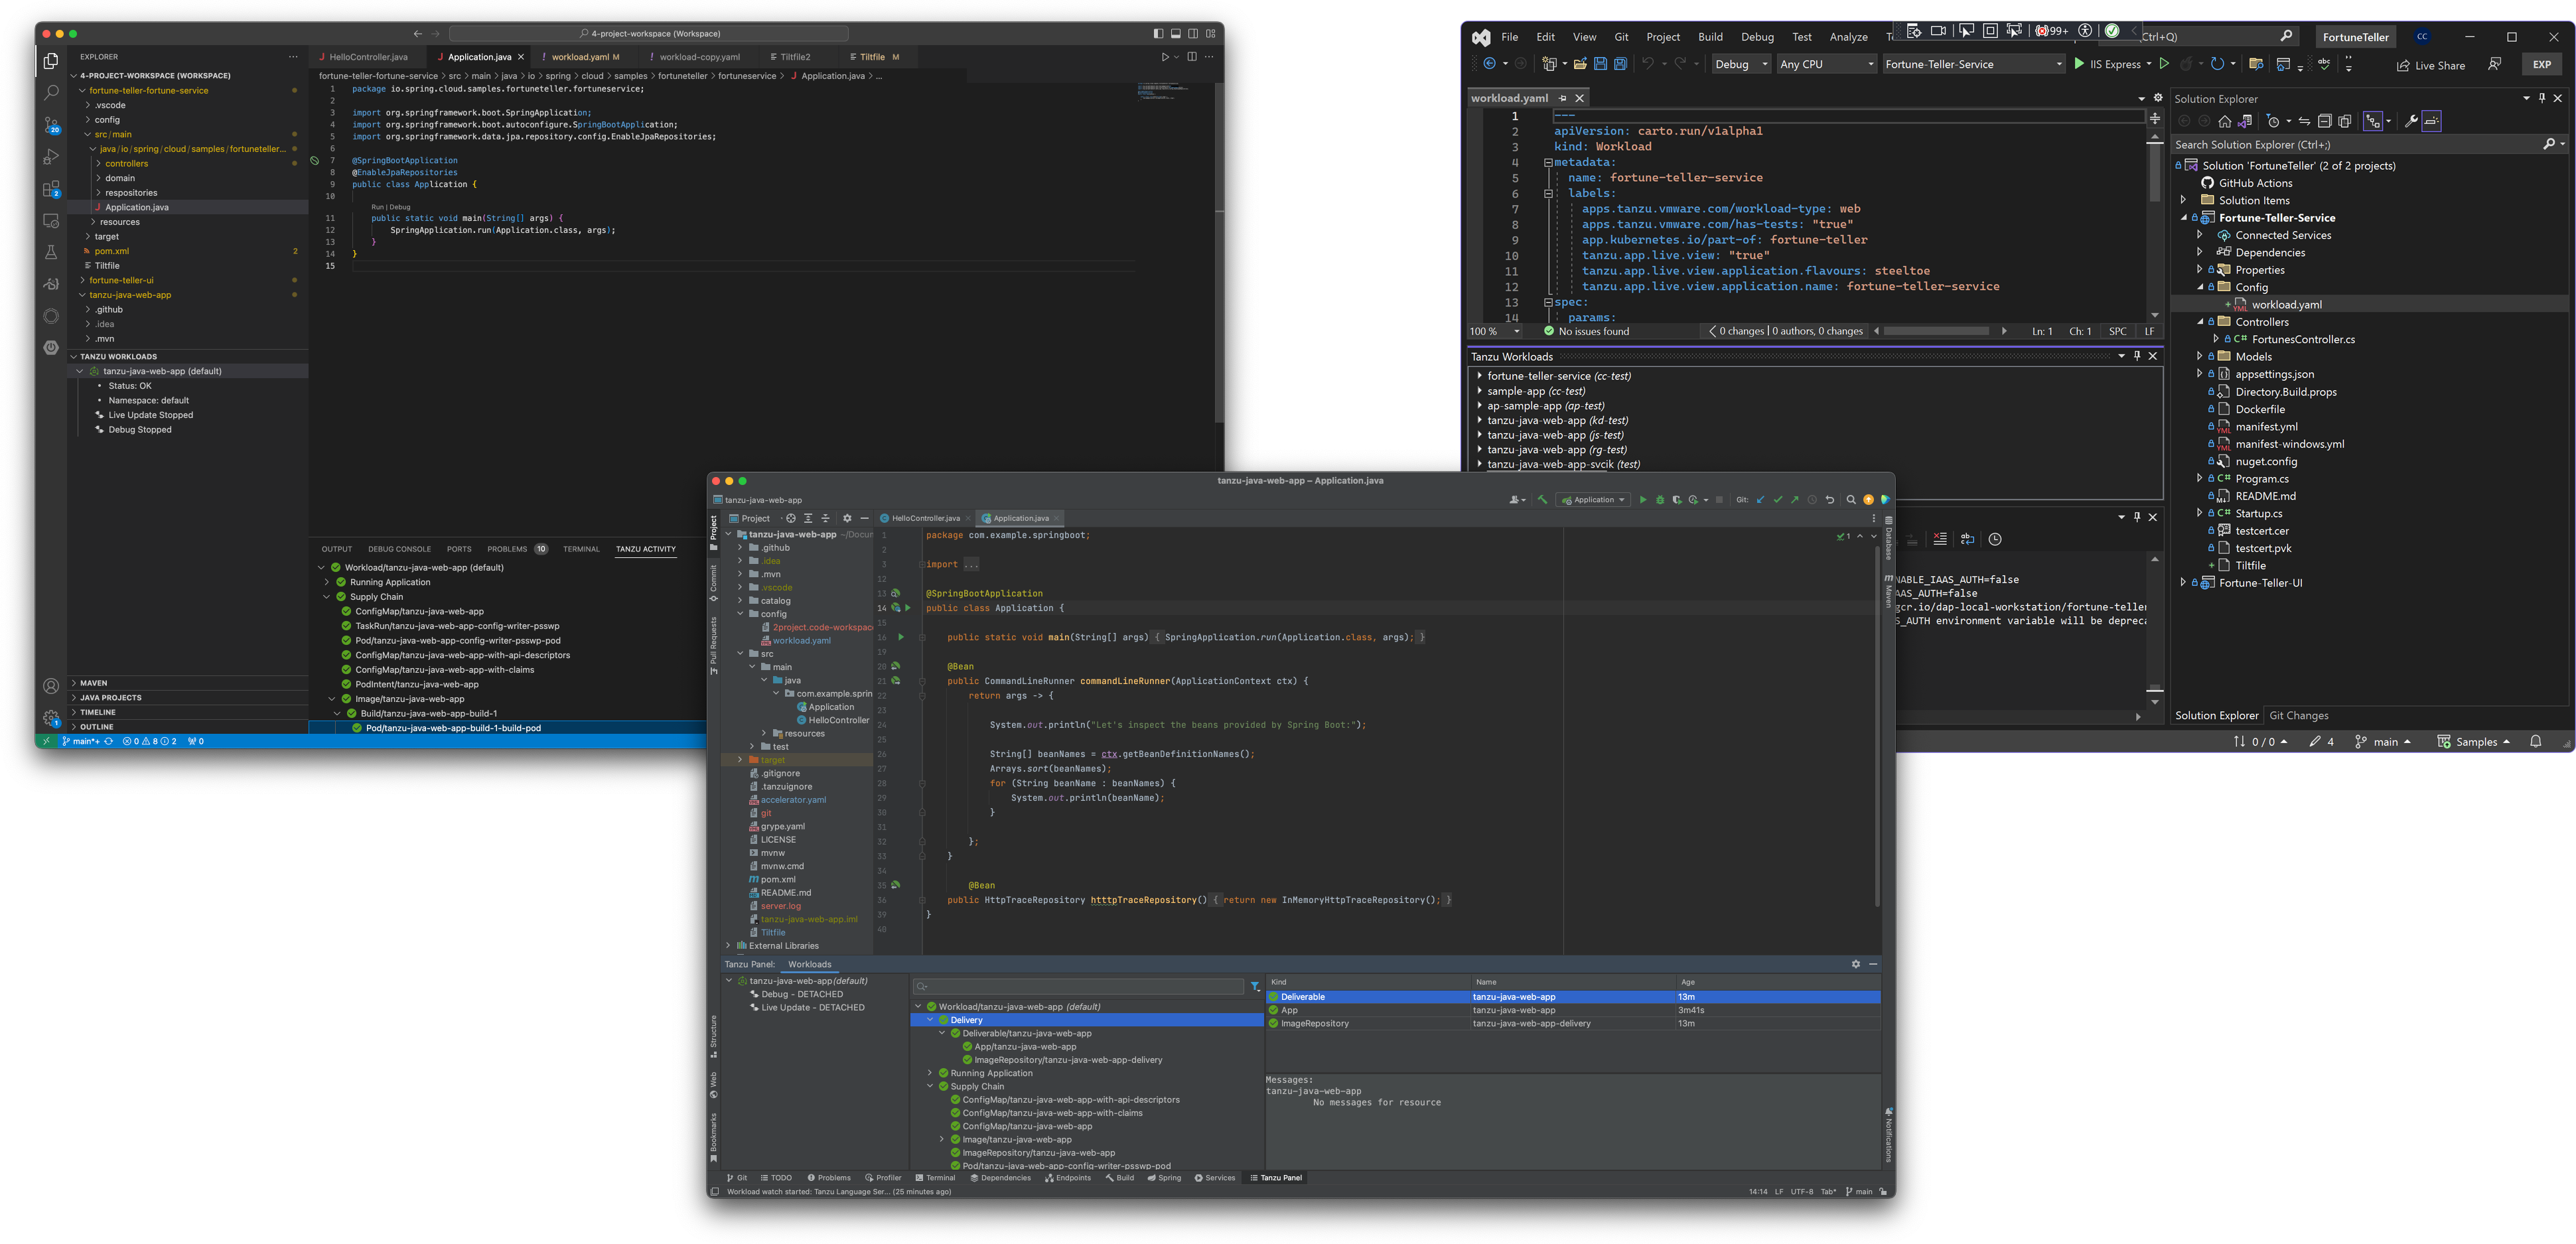
The Tanzu Workload Panel in 3 Separate Code Editors
As I mentioned before, I designed, iterated, tested, and supported through implementation these experiences in three separate Integrated Development Environments (IDEs): VS Code, IntelliJ, and Visual Studio Code. Each IDE had its own conventions and interaction style that I needed to research, understand, and reconcile with our VMware Clarity Design System. I then needed to draft a design, solicit feedback from my team and iterate, and test with application developers to ensure my flow felt natural in that specific IDE.
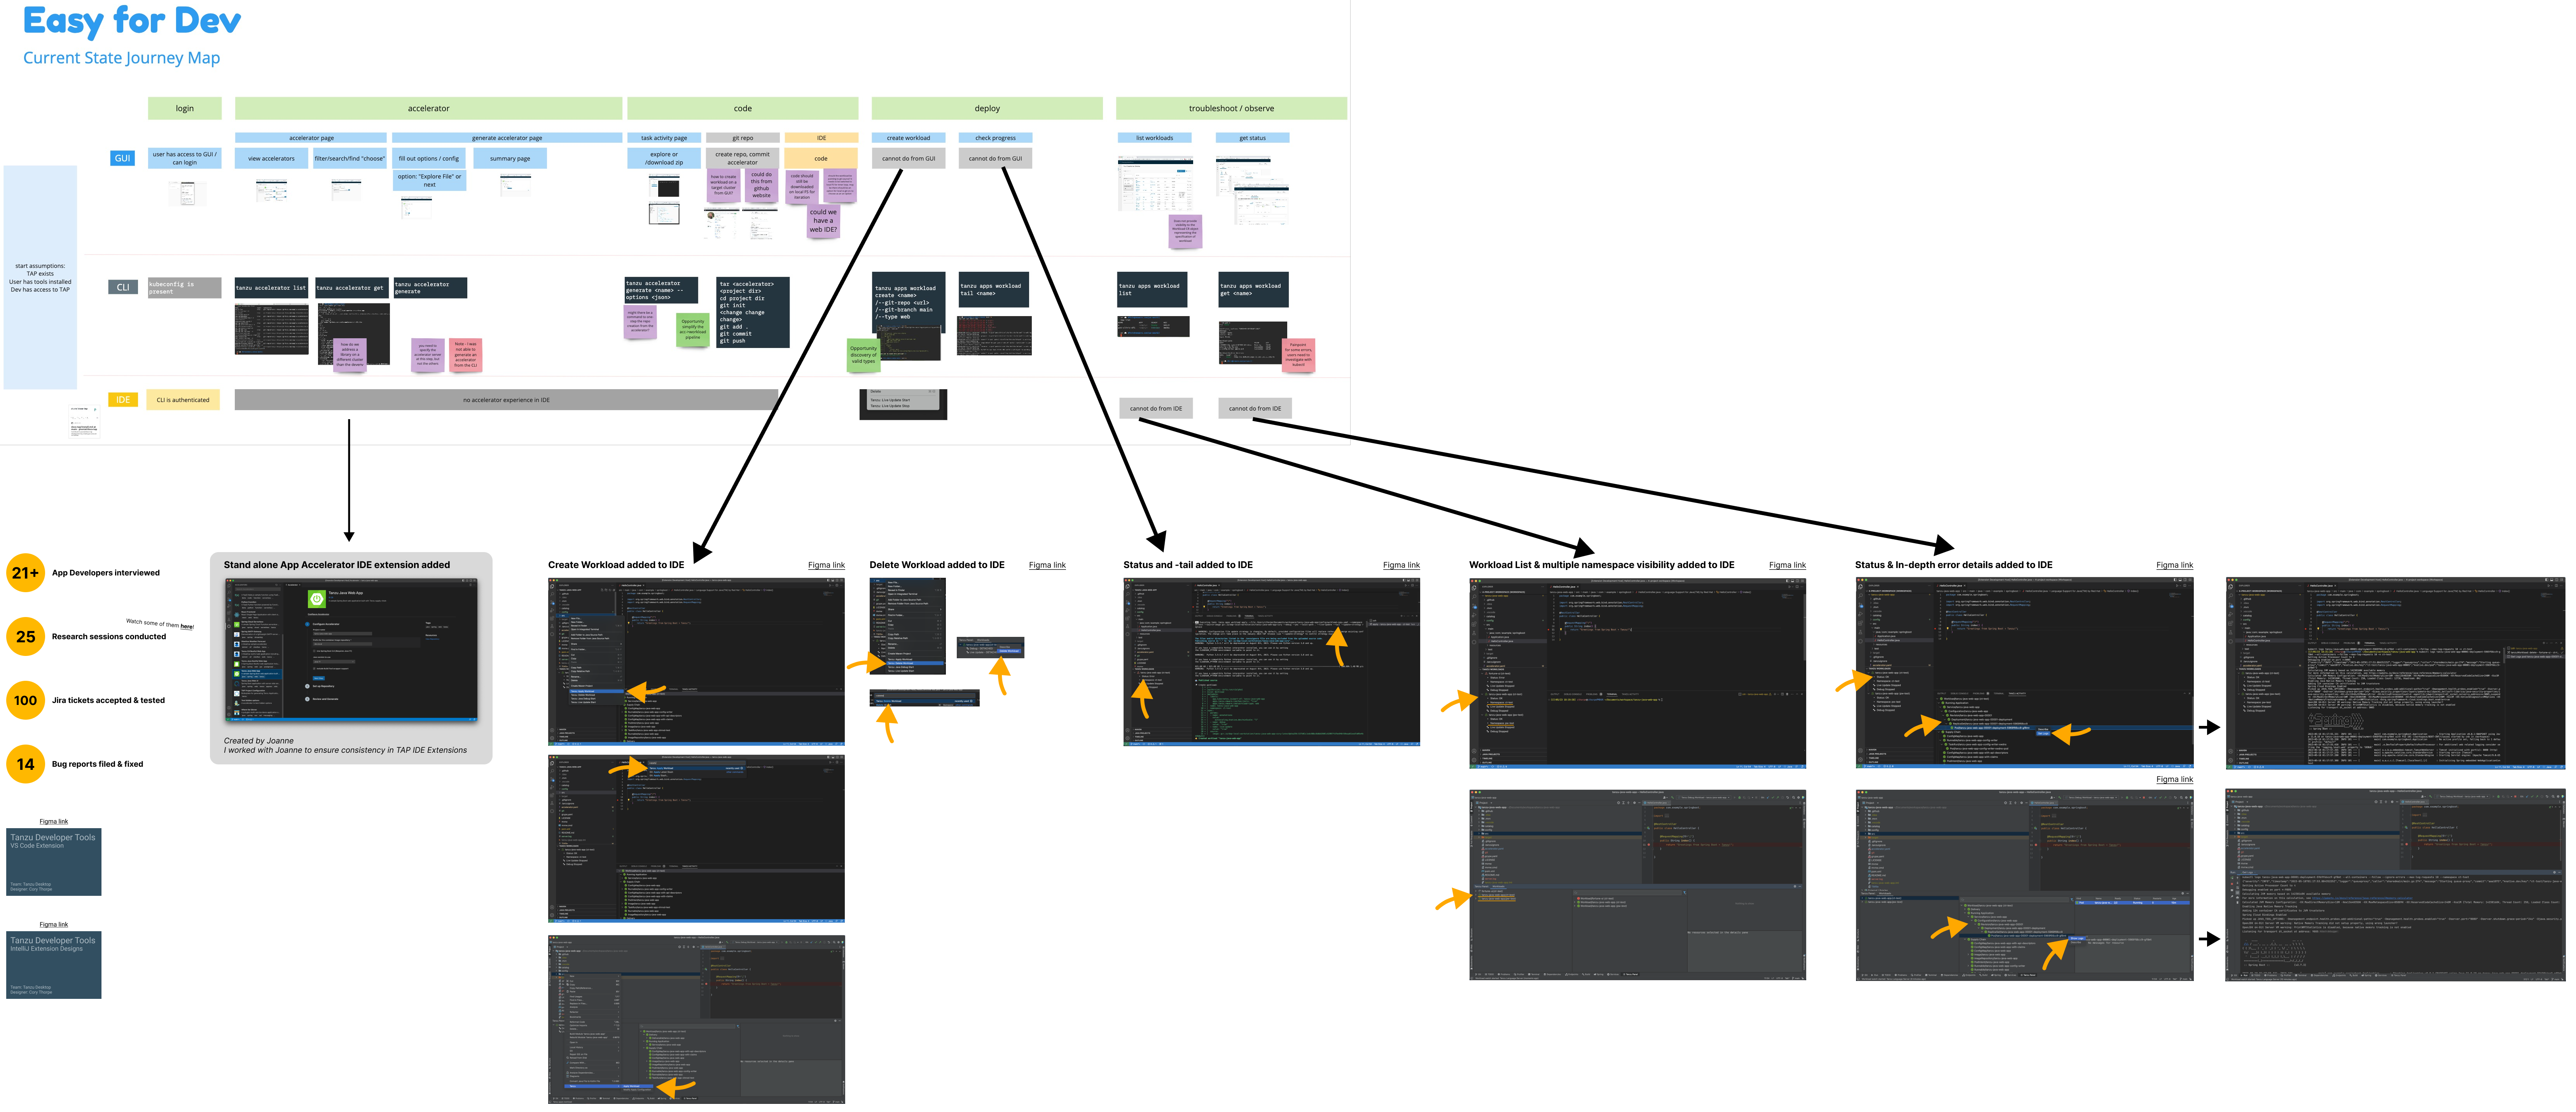
A graphical representation of the design work I completed tied to our entire platform’s target journey map.
The workload panel was just one of the major flows that I worked with my team to design, iterate, test, and release into our Developer Tools extension. Over the course of around a year and a half we took the developer tools experience from nothing to a full extension that developers can and do use to interact with their TAP installations, enabling them to understand and manage their applications. To date we’ve had about 1,000 downloads of our extension and have received very positive feedback. I’ve personally interviewed over 20 application developers, conducted over 25 research sessions, tested over 100 jira tickets related to coding and functionality, and filed 14 bugs that I found through testing.